You're probably in one of two situations right now. You either want the exact revenue number for your own Shopify store, or you want a credible estimate for a competitor and keep finding “revenue checker” tools that act more certain than they should.
Those are two different jobs.
For your own store, Shopify can show you verified sales data inside your admin, reports, and exports. For a competitor, a Shopify store revenue checker is only an estimation workflow. Public tools can't reveal a store's exact live revenue, so most of them rely on the same basic model: Traffic × Conversion Rate × AOV = Revenue. One industry explainer also notes that a practical default for conversion rate is 2%–3% when building a rough estimate, paired with the store's average order value and traffic signal, as explained in BrandSearch's Shopify revenue estimator guide.
That distinction matters because it changes how you use the number. Your own revenue data is for operations, forecasting, and finance. Competitor revenue estimates are for ranking, benchmarking, and spotting who's likely outperforming you in a category. If you also sell on marketplaces or social commerce, the same discipline applies there too. Teams that need cleaner channel-level visibility often pair store analytics with tools for real-time profit tracking for TikTok Shop so they're not mistaking sales volume for actual margin.
Table of Contents
- Understanding Your True Revenue Picture
- Mastering Your Own Revenue with Shopify Analytics
- Interpreting Key Revenue Metrics Like a Pro
- How to Estimate Competitor Shopify Store Revenue
- Advanced Revenue Analysis and Integration
- Troubleshooting Common Issues and Pitfalls
Understanding Your True Revenue Picture
A lot of confusion starts with one word: revenue.
Store owners often mean different things when they say it. Sometimes they mean gross sales. Sometimes they mean net sales after discounts and refunds. Sometimes they mean cash that reached the bank. A Shopify store revenue checker won't solve that ambiguity unless you decide what question you're asking first.
Your store versus someone else's store
For your own store, the answer can be exact because Shopify records the transactions, order timeline, channel attribution, refunds, taxes, and shipping line items inside your account.
For another store, the answer is inferred. You don't have access to that merchant's admin, so every public estimate is based on traces such as traffic, product pricing, review volume, bestseller patterns, and visible marketing activity.
Practical rule: Treat your own Shopify numbers as operational truth. Treat competitor checker outputs as directional intelligence.
That's also why many checker tools feel inconsistent. They're not reading a hidden public ledger. They're modeling. If traffic is overstated, the estimate drifts. If conversion assumptions are too aggressive, the estimate inflates. If the store runs subscriptions, bundles, or private channels, the model can miss important parts of the business.
What a checker is actually doing
At a high level, the common logic is simple:
- Traffic: Estimate how many people visit the store.
- Conversion rate: Assume what share of those visitors buy.
- AOV: Estimate the average value of each order.
Multiply those three and you get a rough revenue estimate.
That framework is useful, but only if you keep the confidence level in check. It can help you compare stores in the same niche, pressure-test your market assumptions, and identify outliers worth deeper analysis. It can't give you audited financials.
What the number is for
A revenue figure is only useful if it helps you make a decision.
Use verified internal revenue to answer questions like:
- Which channels are producing sales you want to scale?
- Which product lines are carrying the business?
- Are discounts, refunds, or shipping costs changing the quality of revenue?
Use estimated competitor revenue to answer a different set:
- Which brands seem to be gaining traction?
- Which product categories appear to support higher ticket sizes?
- Which stores are likely operating in a different revenue band than yours?
That split keeps your analysis honest. It also keeps you from building strategy around a number that was never meant to be exact.
Mastering Your Own Revenue with Shopify Analytics
If you own the store, don't start with third-party checker tools. Start inside Shopify.
The shortest path to trustworthy revenue data is your admin dashboard, then the detailed reports underneath it.
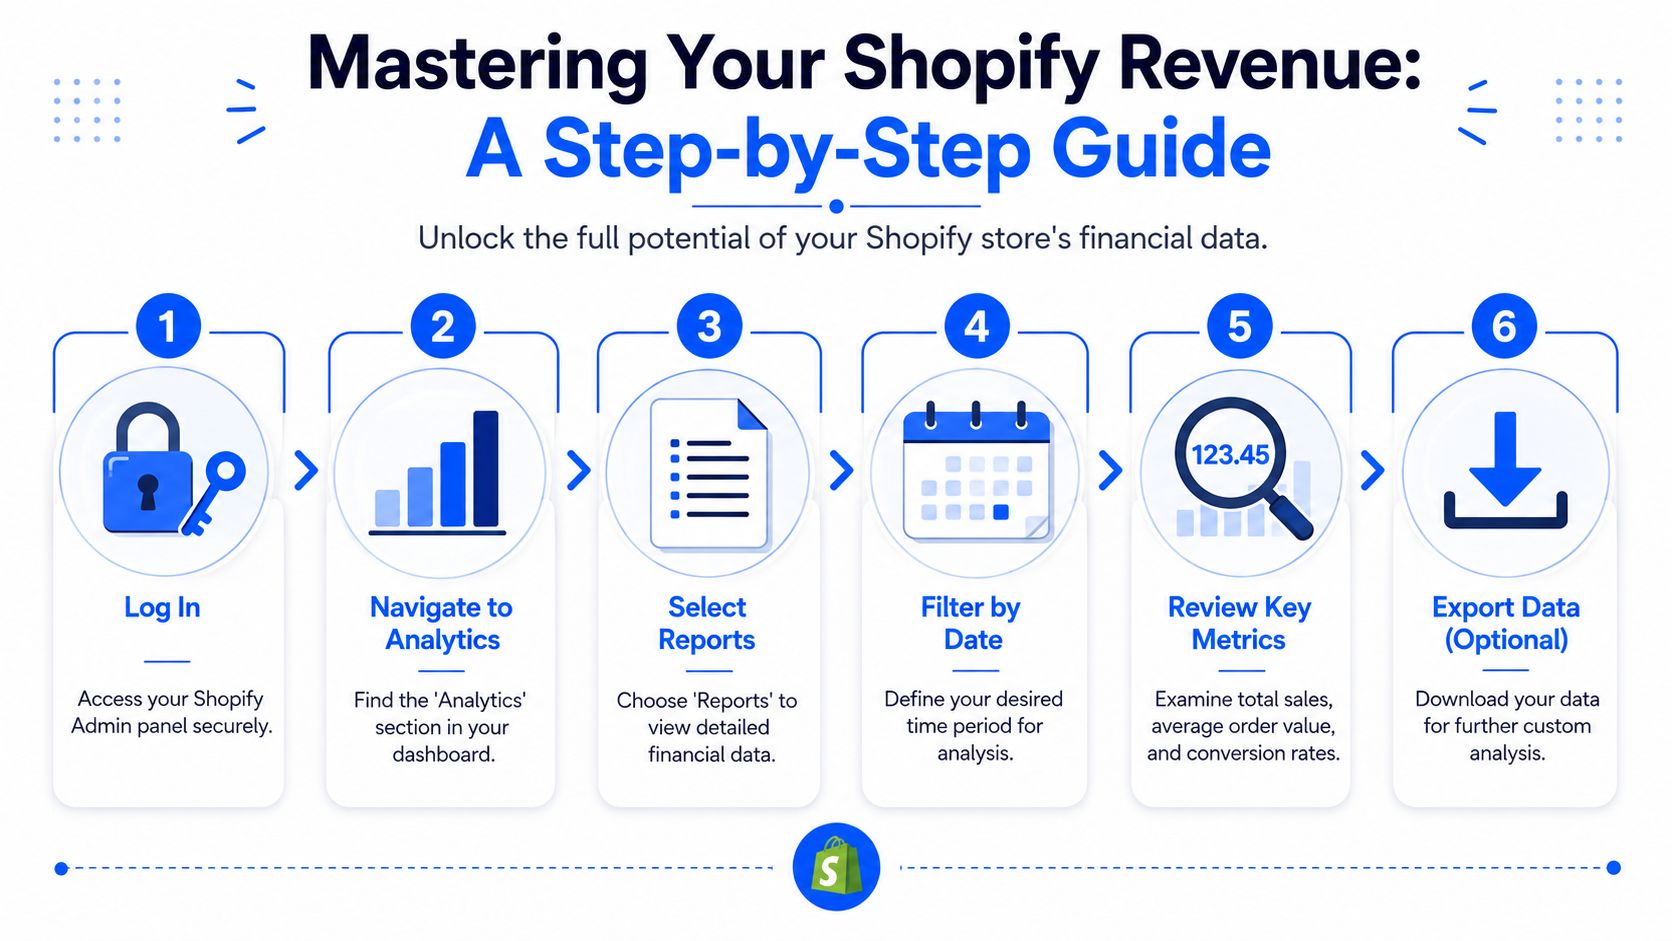
Start with the dashboard, then move into reports
In Shopify Admin, go to Analytics first. This gives you the fast read. Look at the main overview before drilling into any single metric. You want to see whether the period is stable, rising, or volatile.
Then move into Reports. The most useful starting reports are usually:
- Sales over time: Use this to see trend direction, spikes, and drop-offs.
- Sales by product: Use this to see what's generating revenue.
- Sales by channel: Use this to compare Online Store, Shop, social, or other connected sales sources.
That sequence matters. Analysts get into trouble when they jump straight into product-level numbers without checking whether the period itself was unusual.
Use date filters like an analyst
Most revenue misunderstandings come from bad date selection, not bad math.
Use Shopify's date controls to compare:
- Current period versus previous period: Good for quick momentum checks.
- Month versus month: Useful for recent operating rhythm.
- Quarter versus quarter: Better for planning inventory and spend.
- Custom range: Necessary when you're evaluating a campaign, launch, or merchandising change.
Don't pull a revenue number without checking the date filter twice. A wrong date range can make a healthy store look broken, or the opposite.
When you need to share the numbers outside Shopify, export the report. That gives finance, marketing, or operations one stable version of the same dataset. If your team also builds customer-facing quizzes or post-purchase workflows from these insights, it helps to keep your reporting and merchandising tools connected. One practical reference point is VeeForm's e-commerce workflows, which are built around product recommendation and feedback capture rather than raw revenue reporting.
A clean workflow for weekly review
A simple review rhythm works better than an elaborate dashboard no one checks.
- Open Analytics and confirm the date range.
- Check Sales over time for trend changes.
- Open Sales by channel to see where movement came from.
- Open Sales by product to identify concentration risk.
- Export if you need to compare outside Shopify or annotate findings.
What to look for inside each report
Different reports answer different business questions:
- Sales over time helps with pacing. If sales are uneven, you can trace whether it was campaign timing, stock issues, or seasonality.
- Sales by product helps with merchandising. A few items usually do more work than the catalog suggests.
- Sales by channel helps with allocation. A channel with decent revenue but weak margin may deserve less budget than the headline implies.
The point isn't just to “check revenue.” It's to understand which revenue, from where, across what period, and whether it's the kind of revenue you want more of.
Interpreting Key Revenue Metrics Like a Pro
Finding the number is easy. Interpreting it is the part that separates a basic dashboard read from actual analysis.

What the top-line number hides
A store can post strong sales and still create weak business outcomes if too much of that volume is being eroded by discounts, refunds, taxes, shipping complexity, or acquisition costs.
The most useful revenue metrics to separate are:
- Gross sales: The pre-adjustment sales total.
- Net sales: Sales after discounts and returns are reflected.
- Discounts: Revenue given away to drive conversion.
- Refunds: Revenue reversed after purchase.
- Taxes: Collected from customers, but not operating revenue in the way many owners instinctively read it.
- Shipping: Can support contribution margin, hurt it, or be a pass-through.
If you only look at one total number, you miss the operating story.
Use one order to understand the full story
Take a single customer order and break it down line by line. Even without plugging in exact figures, the logic becomes obvious.
A customer buys one item. You record the sale. Then a discount code reduces the selling price. Shipping is charged or subsidized. Tax is collected based on the destination. If the customer later requests a refund, net revenue changes again. If the payment processor settles later, the bank timing changes too.
That's why “Shopify says one number, my bank says another” is such a common complaint. They're not always measuring the same thing.
Revenue analysis works best when you treat each order like a mini P&L, not just a sale confirmation.
Metrics that signal business health
These patterns deserve attention:
- Rising discount usage: This can mean your pricing is getting weaker, your promo calendar is too aggressive, or paid traffic quality is slipping.
- Growing refund volume: This often points to fulfillment issues, product mismatch, or acquisition that's pulling in poor-fit buyers.
- Heavy channel concentration: If most revenue comes from one source, your store may be more fragile than the top line suggests.
For marketers, ad analysis must connect to sales quality. A campaign can look efficient in-platform while sending low-value orders into Shopify. If you're trying to line up acquisition metrics with store outcomes, a solid primer on mastering Facebook Ads data helps frame which campaign numbers deserve trust and which need context from your store reports.
A short walkthrough can help anchor the distinction between sales metrics and meaningful revenue interpretation:
The better question to ask
Instead of asking, “What was revenue?” ask:
- What did we sell?
- What portion stayed after discounts and refunds?
- Which channels produced that revenue?
- Did those sales come from repeatable demand or temporary promotion?
That's how the dashboard becomes useful. It stops being a scoreboard and starts acting like an operating system.
How to Estimate Competitor Shopify Store Revenue
Checking your own store is accounting. Checking a competitor is inference.
That's why most public tools should be treated as a starting point, not the answer. Published benchmarking also shows why exactness is unrealistic. One summary says the average Shopify store earns about $72,000 annually, while the top 10% earn over $1 million, and another groups stores into broad monthly bands such as $0–$1,000, $1,000–$10,000, $10,000+, $100,000+, and $1M+, with average order value often cited around $85 depending on niche, as summarized in TrendTrack's overview of Shopify store revenue ranges. Wide bands like that are exactly why a Shopify store revenue checker should usually produce a range, not a fake exact figure.
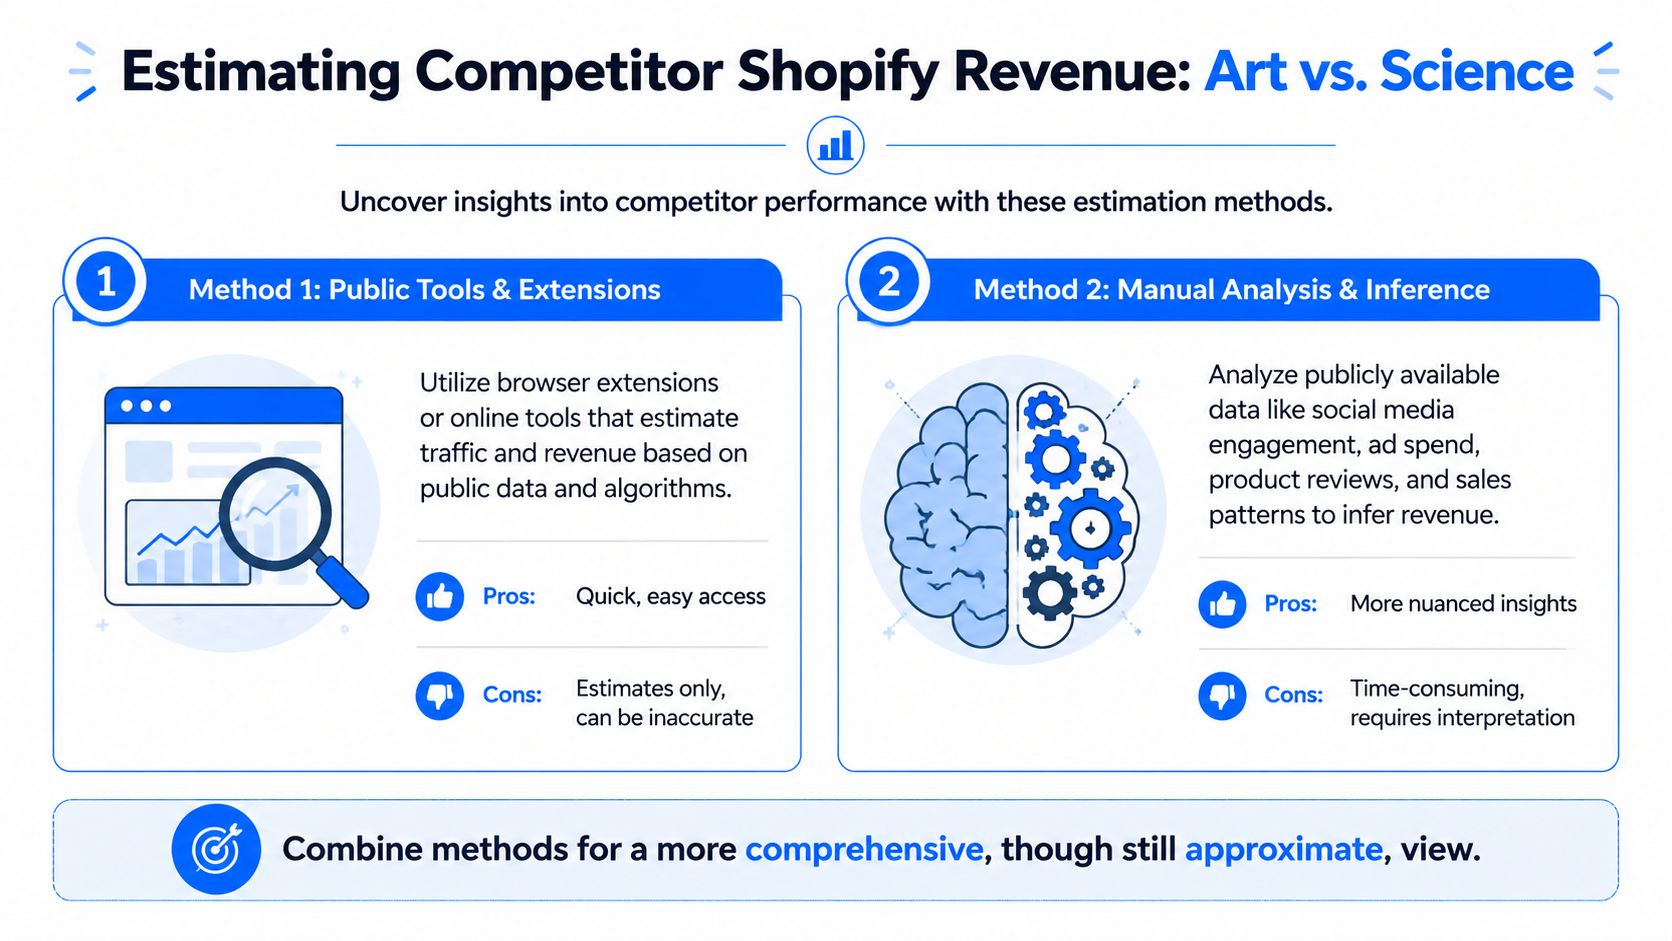
Method one using traffic, conversion rate, and AOV
This is the standard approach because it's fast.
The formula is:
Monthly Revenue = Traffic × (Conversion Rate × 0.01) × AOV
The more careful version of this method uses category-specific conversion assumptions instead of one blanket default. Verified data also notes that using a fixed 2% conversion rate can overestimate lower-converting categories, while category examples such as beauty at 1.8%, electronics at 2.1%, and home goods at 1.5% are used in more disciplined modeling. It also notes that stores with heavy holiday concentration can produce very different monthly outcomes, so triangulating multiple time periods improves reliability, as described in the verified methodology above.
A practical workflow looks like this:
- Pull monthly visitor estimates from a traffic tool.
- Identify the store's category.
- Estimate AOV by reviewing visible pricing on likely best sellers.
- Apply a category-appropriate conversion rate.
- Sanity-check the result against seasonality and promotional intensity.
This works best when the store has visible traffic, straightforward products, and normal buying behavior.
Method two using best sellers and review volume
The stronger manual method starts inside the store itself.
Use the native Shopify path /collections/all?sort_by=best-selling when it's available. Verified methodology notes that this sorts by sales weight rather than homepage merchandising. The process then uses visible product signals to reverse-engineer demand: identify 3–5 top-selling products, collect their review counts, apply a 1.5% review-to-sale rate, estimate unit sales as Review Count / 0.015, then multiply by AOV. The same methodology says this approach can become materially more reliable when combined with traffic data, and that stock-out periods should be handled carefully because they can distort current velocity.
That method is slower, but it often beats generic checker tools because it looks at what the store is selling, not just how many visits a panel thinks it gets.
Public estimators usually fail when they skip the store's product reality. Revenue comes from what converts, not from traffic alone.
When each method works best
Traffic-based estimation is useful when you need a quick market map across many stores.
Best-seller reverse-engineering is better when you need a sharper read on one competitor, especially if the product set is narrow and the store has visible review signals.
Some teams use competitor intelligence platforms to organize these signals alongside ad libraries, assortment changes, and positioning shifts. A practical example is Cyndra AI for business intelligence, which is geared toward competitor monitoring rather than pretending to reveal audited revenue.
Competitor Revenue Estimation Methods Compared
| Method | Required Data | Estimated Accuracy | Best For |
|---|---|---|---|
| Traffic, conversion rate, and AOV | Traffic estimate, category, product pricing | Stronger when category-specific assumptions and seasonality checks are used | Fast scans across multiple competitors |
| Best-seller and review reverse-engineering | Best-selling products, review counts, visible pricing, stock context | Stronger for focused analysis when public product signals are rich | Deep dives on one store or one category rival |
A simple decision rule
Use the traffic model first if you're screening a market.
Use the best-seller method when a store matters enough to investigate properly.
Use both when the estimate will influence budget, product strategy, or competitive positioning. If the methods point in different directions, don't average them blindly. Investigate why. One of the assumptions is probably wrong.
Advanced Revenue Analysis and Integration
Built-in reports are enough for routine checks. They're not enough for every strategic question.
Once you export store data into a spreadsheet, the analysis gets much more flexible. You can sort by SKU, compare time windows, build pivots, isolate refund-heavy products, and create your own product or channel views that don't exist in the default dashboard.
Why exports matter
A CSV export lets you work the way analysts work. You can join datasets, annotate changes, and build custom views for the business questions that matter most.
That usually means things like:
- Product concentration analysis: Find out whether a small number of SKUs drive most of your sales.
- Channel quality review: Compare revenue by channel with refunds or discount exposure.
- Time-based comparisons: Look at launches, promotions, and merchandising changes side by side.
For more technical teams, the Shopify API can support a custom reporting layer. That's useful when finance, marketing, and operations all need slightly different definitions from the same commerce data.
Turn revenue findings into merchandising actions
The value of analysis is what you do next.
If exports show that a narrow group of products consistently leads sales, that should shape how shoppers discover products on site. Instead of forcing visitors through a broad catalog, you can route them with quizzes, fit finders, or recommendation forms tied to those proven items.
One option for that workflow is VeeForm's AI form generator, which can be used to build recommendation quizzes, sign-up forms, and feedback flows from the product patterns you identify in revenue exports.
A practical export workflow
A clean process looks like this:
- Export sales data for a meaningful date range.
- Group results by product, channel, or collection.
- Flag products with strong sales but weak supporting conversion paths.
- Build a customer-facing experience that guides buyers toward those proven items.
- Recheck results after the change to see whether mix or average order behavior improved.
Good revenue analysis doesn't end in a spreadsheet. It changes what customers see, what teams promote, and what the store prioritizes.
That's where “checking revenue” becomes useful. It stops being passive reporting and becomes a merchandising input.
Troubleshooting Common Issues and Pitfalls
Most revenue confusion comes from mixing unlike numbers.
Why your own numbers may not match payouts
Shopify sales reports, payment processor payouts, and bank deposits often operate on different timelines. Sales may be recorded immediately, while payouts batch later. Refund timing can also push activity into a different reporting window than the original order.
Permissions can create confusion too. If a staff account can't access the right reports, people end up comparing partial views and assuming the data is wrong.
Use one source for each question:
- Shopify reports for sales activity
- Payout reports for settlement timing
- Bank records for cash receipt confirmation
When to distrust competitor checker outputs
Here, many find themselves at a disadvantage.
A key reliability issue is weak public signal quality. Verified guidance notes that newer storefronts, subscription-heavy brands, and stores that rely on private channels can be badly misread by traffic-driven estimators, and that you should triangulate three or more methods because the signals often disagree, as explained in StoreInspect's guide to checking Shopify store revenue.
Use skepticism when:
- The store is new: There may not be enough traffic, review, or backlink history to support a stable estimate.
- The brand sells through private channels: Email, wholesale, creator deals, and direct relationships may not leave strong public traces.
- The catalog suggests recurring purchases: Subscription-heavy brands can look weaker or stronger than they really are depending on what the estimator captures.
- Signals conflict: If traffic looks modest but review volume is high, or product pages suggest strength but ad visibility is thin, don't force precision.
You can also gather your own first-party evidence to explain gaps in store performance. A simple way to do that is to collect structured buyer feedback with a shopping experience feedback form template, then compare customer comments with what your sales and refund patterns are already suggesting.
The main discipline is simple. Use exact numbers only when you own the data. Use ranges when you don't.
If you want to turn revenue insights into something operational, VeeForm can help you build quizzes, feedback forms, and product recommendation flows that reflect what your sales data is already telling you. That's useful when you've identified top-performing products or common purchase barriers and want to act on them without waiting on a custom build.